
How to Analyze Forex Market Trends More Effectively
Understanding market trends is the foundation of successful Forex trading. Many traders struggle to identify reliable trends, leading to mistimed entries and preventable losses. This guide presents practical methods to analyze Forex market trends more effectively, combining traditional technical analysis with modern automation tools. You'll learn how to use multiple timeframes, key indicators, and AI-assisted platforms to make better-informed trading decisions.
Understanding the Three Types of Market Trends
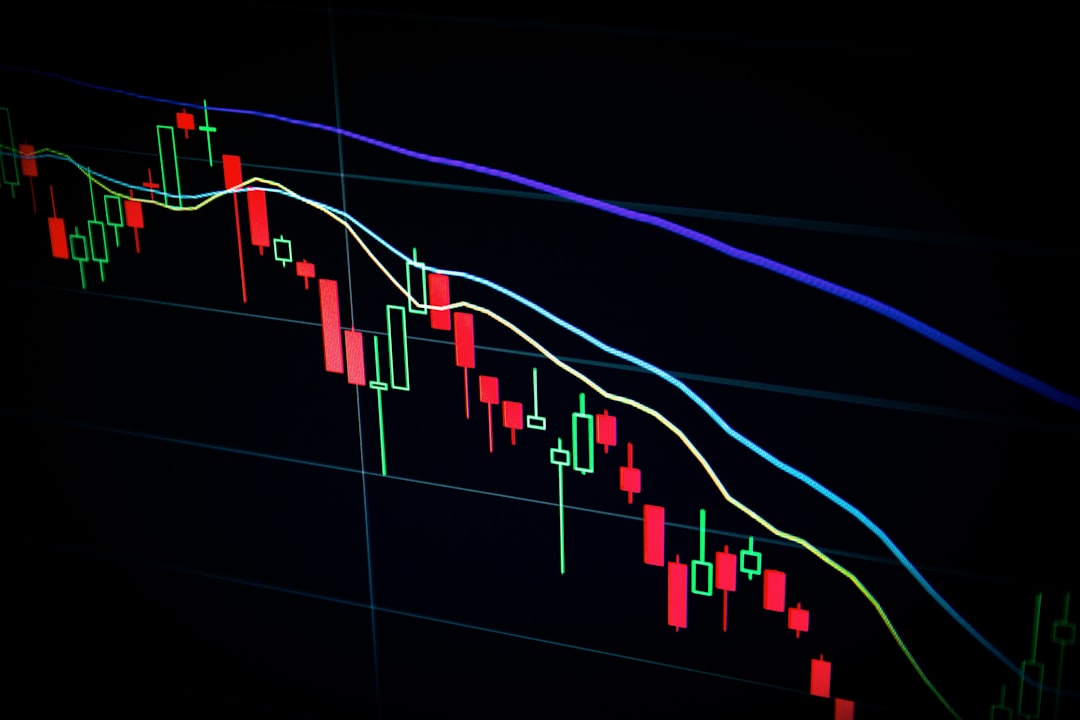
Before diving into analysis techniques, you must recognize the three fundamental trend types in Forex markets. An uptrend occurs when price makes higher highs and higher lows, signaling bullish momentum. A downtrend shows lower highs and lower lows, indicating bearish control. A sideways trend or range-bound market moves horizontally between support and resistance levels.
The most critical skill is determining which trend dominates your trading timeframe. Professional traders analyze multiple timeframes simultaneously—examining daily charts for overall direction while using 4-hour or 1-hour charts for precise entry timing. This multi-timeframe approach prevents trading against the dominant trend, which is a common mistake among beginners. Remember that trends on different timeframes can conflict, so always align your trades with the longer-term direction.
Essential Technical Indicators for Trend Analysis
Effective trend analysis requires combining several technical indicators rather than relying on a single tool. Moving averages remain the most fundamental trend-following indicators. The 50-period and 200-period moving averages help identify major trends, while crossovers between shorter and longer averages generate potential trade signals.
The Relative Strength Index (RSI) measures momentum and identifies overbought or oversold conditions within a trend. Values above 70 suggest overbought conditions, while readings below 30 indicate oversold markets. However, during strong trends, RSI can remain in extreme zones for extended periods. The MACD (Moving Average Convergence Divergence) combines trend-following and momentum characteristics, making it valuable for confirming trend direction and spotting potential reversals through divergences.
| Indicator | Best For | Timeframe |
|---|---|---|
| Moving Averages (50/200) | Identifying overall trend direction | Daily/4H |
| RSI | Spotting momentum shifts and extremes | 1H/4H |
| MACD | Confirming trend strength and reversals | 4H/Daily |
| ADX | Measuring trend strength (not direction) | Daily |
Chart Patterns and Price Action Analysis
Beyond indicators, recognizing chart patterns provides crucial context for trend analysis. Continuation patterns like flags, pennants, and triangles suggest the existing trend will resume after a brief consolidation. Reversal patterns such as head and shoulders, double tops, or double bottoms warn of potential trend changes.
Price action analysis focuses on candlestick formations and key levels without relying heavily on indicators. Support and resistance zones mark areas where price historically reversed or paused. When price breaks through significant resistance during an uptrend, that level often becomes new support—a concept called role reversal. Observing how price reacts at these levels provides valuable clues about trend strength and potential continuation or reversal.
Leveraging AI and Automation for Trend Analysis
Modern traders increasingly use AI-powered tools and automated systems to enhance trend analysis. Machine learning algorithms can process vast amounts of historical data to identify patterns invisible to human traders. AI trading bots can monitor multiple currency pairs simultaneously, scanning for specific trend conditions based on predetermined criteria.
However, automation isn't a replacement for understanding market fundamentals. The most effective approach combines AI assistance with human oversight. Use automated scanners to identify potential trending pairs, then apply your analytical skills to validate signals. Some platforms offer backtesting features that let you test trend-following strategies against historical data, helping refine your approach before risking real capital. Remember that even sophisticated AI systems require proper configuration and regular monitoring to adapt to changing market conditions.
Combining Fundamental Analysis with Technical Trends
While technical analysis identifies trends, fundamental factors explain why they occur. Economic indicators like GDP growth, employment data, and central bank interest rate decisions create the underlying forces driving currency movements. A strong technical uptrend in EUR/USD might reflect improving European economic data or dovish Federal Reserve policy.
Savvy traders monitor economic calendars and understand how major announcements affect their traded pairs. When technical signals align with fundamental drivers, trend reliability increases significantly. For instance, if technical indicators show a strong downtrend in a currency whose central bank just announced rate cuts, the trend has both technical and fundamental support, making it more likely to continue.
Mastering Forex trend analysis requires combining multiple techniques—technical indicators, chart patterns, price action, and fundamental awareness. Start by identifying the dominant trend on higher timeframes, confirm with multiple indicators, and validate with fundamental context. Whether you trade manually or use AI-assisted tools, consistent application of these principles will improve your trend analysis effectiveness. Practice these methods on a demo account before implementing them with real capital, and continuously refine your approach based on results.